Saturday, February 27, 2016

Unstructured Data v/s Structured Relational Data

Unstructured Data v/s Structured Relational Data

Data is a set of values and facts of quantitative and qualitative variables. Data as a general concept refers to the fact that some existing information or knowledge is represented or coded in some form suitable for better usage or processing. Data is measured, collected and reported, and analyzed, whereupon it can be visualized using graphs or images. Data in its raw form is always irrelevant and does not make any sense to the person reading it. To make it more readable or rather usable, data needs to be structured. It is important to understand the difference between structured and unstructured relational data.

Structured Data
Structured Data refers to information with a high degree of organization, that is, data that is stored in an organized manner. It resides in a fixed field within a record or file. Normally data that is stored in relational databases or on spreadsheets in an orderly row and column format forms structured data. In order to store structured data, one must create a data model that specifies the business data that one has to deal with along with the data types such as numeric, alphanumeric, Boolean, etc., data constraints such as primary, referential integrity, check, not null, etc. and metadata information. Because it is well ordered, structured data can be easily entered, stored, queried and analyzed. SQL is most commonly used to manage structured data. SQL helps us perform several operations to analyze the data and fetch desired results. These operations include search, insert, update, delete and others.

Unstructured Data
As the name suggests, unstructured data refers to data that is unorganized and is unable to dwell inside a database or on a spreadsheet. They are difficult to be process and generate reports. Unstructured data comprises of text and multimedia content. A few examples are videos, photos, audio files, presentations and many other kinds of business documents. We know that the business documents follow a structured approach, but their content is unable to fit in a database and so they are categorized as unstructured data. Business Documents within an organization are unstructured data that contain a large amount of useful information that are important in strategic decision-making. It is important to gain valuable insights into this data and hence organizations are now inclined to various technologies such as Hadoop, Data Mining tools, Business Intelligence software and many other technological solutions. The term Big Data is closely associated with unstructured data. Big data refers to extremely large datasets that are difficult to analyze with traditional tools. Although Big Data can include both structured and unstructured data, research show that 90 percent of big data is unstructured data. 


The following table shows also shows the differences between structured and unstructured data:


Experts estimate that 80%-90% of the data in any organization is unstructured. And the amount of unstructured data in enterprises is growing significantly, often many times faster than structured databases are growing. The figure below shows the growth of unstructured data as compared to that of structured data:

Since the volume of unstructured data is increasing significantly, it is important for organizations to look for technological solutions to help them better manage and store these type of data. These technological solutions could be either software or hardware that would enable the organization to store their storage space most efficiently. Various technological solutions for structured and unstructured data are shown in the figure below:


Types of Data

Spatial Data: Spatial data is the information that has several dimensions. Data that gives importance to location or position with respect to some entity is spatial in nature. For example, maps or images taken from space, remote sensing data, coordinates of a place etc.

Redundant Data: This kind of data refers to duplication of data. It means that the same information is replicated at multiple areas. Such data may be the cause of inefficiencies within a system.

Integrated Operational Data: This type of data is a result of organization’s daily business activities. It is an easily changing collection of data. An integrated operational data store is a subject-oriented, integrated, volatile, current-valued, detailed-only collection of data.

Legacy Data: Legacy data pertains to data from disparate sources, which are old and outdated but still in use because they form the basis of an organization. E.g., XML data, hierarchical & network data, objects, etc.

Fore Data: Fore data are used for describing data architecture’s objects and events. Their primary purpose is presentation only. They are basically the upfront data.

Demographic Data: This data deals with information about the human population such as size, structure, distribution, and spatial and temporal changes.

Integrated Historical Data: This data forms part of the enterprise data that passes through the process of ETL (Extract, Transform and Load). It is stored in a data warehouse and is static in nature. Data in a data warehouse is subject-oriented, non-volatile, integrated and time-variant. This data is also historical and serves the key purpose of statistical analysis. It provides insights to various trends of an organizations relating to revenue, sales among others. An operational database fails to deliver such results. A few key characteristics of data warehouse that facilitate statistical analysis are:
Denormalization of data that simplifies and improves the query performance
No frequent updates makes it performance relaxed
Eases consolidation of data from different sources
Use of historical data in studying trends and patterns

The following figures show the non-volatile nature of Data Warehouse:


Other classification of type of data used today are digital assets, business records, email messaging, specialized web data etc.

Data Warehousing
Data warehouse is a system used for reporting and data analysis. They are central repositories of integrated data from one or more disparate sources and store current and historical data and are used for creating analytical reports for knowledge workers throughout the enterprise. The following video gives an overview about Data Warehousing.


Limitations of Data Warehousing in terms of Data Analysis

The main limitations are as follows:

Inconsistent Data: While loading data, care should be taken to see that the data is consistent or else it might result in performance degradation.

Time Taking: It might take long to extract, transform and load the historical data and hence, the time to develop the data warehouse would also significantly increase.

High Maintenance: These are high maintenance systems. Also they have high initial cost. Any change in the business process or the source system that results in a change in the data warehouse, it would result in very high maintenance costs.

Integration Complexity: Integration of data from various sources is a highly complex. Also, since different tools perform different tasks within a data warehouse, integrating them also increases the complexity of implementing a data warehouse.

Important Data not Captured: In some cases, important information related to the business process under analysis is not captured. These may be important for strategic decision making.

Others: Data owners lose control over the data which in turn raises security and privacy issues. Adding a new data source takes a lot of time. Typically the data is static, limited drill-down capabilities are also few limitations.  

Future of Data Warehousing

For a successful implementation of data warehouse for any particular business, it takes years. Any integration requires a lot of effort to ensure consistency. As a result, in the future, an agile model of data warehouse is expected. This model would no longer increase the implementation speed and would facilitate discovery-based analytics. In future, new capabilities could be added to data warehouses so that they handle new types of data. Servers can also be engineered to handle much larger data volumes and workloads. Go as you grow: Just like anything else in enterprise computing, “data warehousing” will fade away as something you don’t have to think or worry about. It will just be there, similar to electricity, enabling amazing things such as finding insights, telling stories, making decisions. 

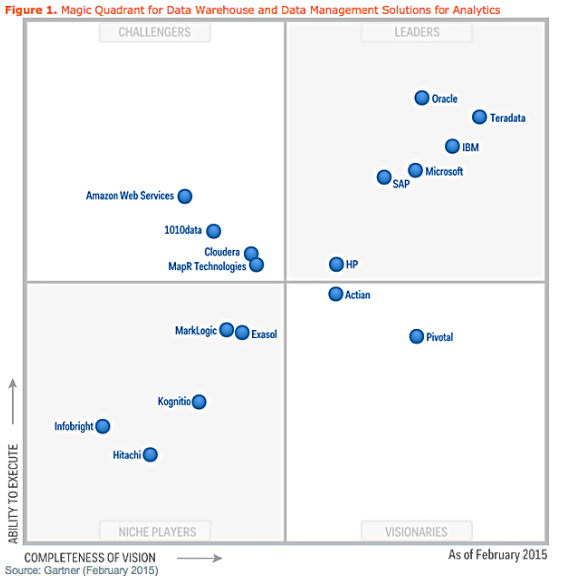
In my opinion cloud-based solutions for data warehousing and analytics might become the standard. The flexibility of the cloud-based solution not only offers performance enhancements but also a native understanding of the wide range of analytic support provided by the data such as Data Services, Big Data and BI Consulting. With cloud based solution the cost of traditional on-premises offerings as well as management overhead costs will be significantly lowered. The following image shows the list of best available Data Warehouse solutions for analytics.


References


Saturday, February 13, 2016

How Dimensional Modelling can help Walmart to analyze performance


Hello everyone, 

This blog is about demonstrating how dimension models can be used to help the analysis of the performance metrics for an industry or a firm. I have chosen Walmart and will be applying the dimension modeling concepts on various performance metrics the CEO of Walmart would be interested in.  

Walmart is an American multinational retail corporation that operates a chain of hypermarkets, discount department stores and grocery stores. It is headquartered in Bentonville, Arkansas. Walmart was founded by Sam Walton in 1962 and incorporated on October 31, 1969. As of December 31, 2015, it has a total of 11,620 retail stores in 28 countries, under a total of 65 banners. Walmart is the world's largest company by revenue, according to the Fortune Global 500 list in 2014, as well as the biggest private employer in the world with 2.2 million employees. It is also one of the world's most valuable companies by market value, and is also the largest grocery retailer in the U.S. In 2015, it generated 59.8 percent of its US$288 billion sales in the U.S. from its grocery business. Walmart's reputation is for "low prices". 

Walmart has a multi-national footprint. It is a huge company and as we know that the larger the company grows, measuring and analyzing the performance is challenging. Walmart’s business model focuses on providing customers product with low prices and focus on the number of sales (quantity) they make. Doug McMillon, the CEO of Walmart, would like to measure and analyze the performance of Walmart so that improvements and enhancements could be made. But performance measurement for a company like Walmart could be in any of the following domains:

•  Retail Sales
•  Inventory
•  Order Management
•  Procurement
•  Financial Services and so on

For the purpose of this blog, I will be focusing on the retail sales process as that is the main purpose of Walmart- to sell products at low prices.  From a performance perspective, few metrics that the CEO would be interested in are: Sales Quantity, Total Discount Dollar Amount, Total Sales Dollar Amount and Total Cost Dollar Amount. He might be interested in these metrics across stores and products. It is certain that their profitability depends on the quantity they sell. Higher the quantity sold, higher is the profit. The CEO might be interested in the discount given to the customers, to see if the sales increase during that period. Time and again special discount offers are given to attract more customers. It is really critical to be logical and reasonable with the offers made and not be overwhelmed by it. Again, to answer so as to how the business is performing, one needs to analyze the total cost and sales dollar amounts. These two metrics determine the profitability to the company. Thus I feel these metrics would be really important for measuring the performance. 

For a company like Walmart, dimension model can help them analyze the performance metrics efficiently and enable them to make improved decisions. Data modeling can help in the process of performance improvement, optimization and even minimizing the cost. Data Modeling is a logical design technique that seeks to present the data in a standard, intuitive framework that allows for high-performance access. The dimensional model has a number of important data warehouse advantages. They are:
•  Dimensional model is a predictable, standard framework. Report writers, query tools, and user interfaces can all make strong assumptions about the dimensional model to make the user interfaces more understandable and to make processing more efficient
•  Dimension model withstands unexpected changes in user behavior. Every dimension is equivalent. All dimensions can be thought of as symmetrically equal entry points into the fact table. The logical design can be done independent of expected query patterns. The user interfaces are symmetrical, the query strategies are symmetrical, and the SQL generated against the dimensional model is symmetrical
•  Dimension model is gracefully extensible to accommodate unexpected new data elements and new design decisions. Data should not have to be reloaded. No query tool or reporting tool needs to be reprogrammed to accommodate the change. The old applications continue to run without yielding different results

Dimensional Model also helps in analyzing at the lowest level of granularity. For example, in case of Walmart the CEO might want to know which product in which store on what date under what discount was sold the most (sales quantity). It helps to go to that level of detail. Dimensional modelling really simplifies analysis and help improve the performance. 

The type of dimension model for Walmart should be periodic. The reason is that it summarizes the metrics/measurements over a standard period like a day, week, month etc. I feel a periodic dimensional model that captures information per week is the best option as it would give the weekly quantity sold, discounted dollar amount, total cost and sales amount. A per day periodic snapshot might be useful while analyzing the inventory levels. 


A sample Dimensional Model for Walmart’s Retail Sale could be like this:


 Walmart's Customer Proposition and Track record for delivering value


References:
https://en.wikipedia.org/wiki/Walmart
http://www.walmart.com/
http://www.kimballgroup.com/1997/08/a-dimensional-modeling-manifesto/
http://stock.walmart.com/investors/our-strategy/

Wednesday, February 3, 2016

Business Intelligence and Analysis Products

Business Intelligence and Analysis Products

Hello everyone, 

This blog is about the scanning and evaluation of various business intelligence and analysis products which I have chosen. The analysis is based on the core criteria which I zeroed down to based on my research. I hope you all will enjoy reading this blog and gain value as I share my knowledge based on my findings and research.  

Business Intelligence
Business Intelligence is a set of tools and techniques to analyze an organization’s raw data. Business Intelligence technologies provide historical, current and predictive views of business operations. It includes functions like reporting, data mining, analytical processing, business performance management and many more. It is a broad term (like an umbrella) that refers to a variety of software applications used to transform raw data into useful and meaningful information for business analysis purposes.   

Weighted Criteria Analysis of Business Intelligence Tools

There are a lot of Business Intelligence and Analysis products or tools available in the market and the count is only increasing as time passes by. All the five tools which I have selected for the analysis fall in the Gartner magic quadrants. They are as follows:
Tableau
Tibco Spotfire
Pentaho
Qlik View
Birst

1. TABLEAU
Tableau is a data visualization product focused on business intelligence. It is a business intelligence software that allows anyone to easily connect to data, visualize it and then create interactive and sharable dashboards. It is very simple and can satisfy the most complex analytical problems. It’s built on the technology that translates pictures of data into optimized database queries. Viewing patterns, identifying trends and gaining insights takes only seconds and does not involve any scripts or wizards.

Strengths
Flexible and excellent dashboard
Effective data integration from sources like Oracle, SQL Server and others
High quality support by quickly resolving issues
Easy interaction with business data enabled by intuitive visual insights
Ease of use as it does not require any technical knowledge in order to use Tableau
Low implementation costs
Weakness
Does not have a robust security system
No support for features that perform extended and predictive analytics
Lacks enterprise features
Inefficient in custom modifications or third-party plugins
It has a limited product line focused on data discover

2. TIBCO Spotfire
TIBCO software provides integration, analytics and events processing software for companies to use on-premises or as part of cloud computing environments. TIBCO Spotfire is a leading data discovery and interactive visualization product that offers business users and analysts the ability to access, combine, prepare and visualize data in the form of highly interactive analytic dashboards. It also offers advanced analytic capabilities through integration with Tibco's Enterprise Runtime for R (TERR), and is a leader in geospatial, location analytics, and real-time use cases. Spotfire is highly rated by the customers.

Strengths
Excellent in geo-based analytics and provides advanced analytic capabilities
Extensive feature set due to integration of expert capabilities through acquisitions
Strong predictive & advanced analytics capabilities help examine data with new perspectives
Highly scalable and rapid visualization as it is an in-memory BI platform
Weakness
Requires technical knowledge for the users to be able to work on it. Not that easy to use
Features like statistical tables are not easy to format and also not flexible
Lack of functionalities to personalize visualizations
Struggled with the market positioning and sales execution of Spotfire since it was acquired

3. PENTAHO        
Pentaho provides data integration, OLAP services, reporting, ETL capabilities, data mining etc.  It is in the Niche Players quadrant in the Gartner report due to its focus and innovation in the big data analytics space. Pentaho is transforming from an open-source-based BI platform into a big data and embedded analytics specialist, enabling significantly more complex use cases. Pentaho's data integration (PDI) and analytics components (Weka and Data Science Pack) are at the core of this transformation, delivering tight integration with Hadoop and other NoSQL databases as well as support for advanced analytics with R. 

Strengths
Easy to use tool with visually attractive data analysis
The performance is really good because of in-memory caching techniques
Easy integration and access of data from different sources
Seamlessly integrates with third-party applications and supports platforms like android windows, iOS
Weakness
Comparatively weaker visualization and advance analytics (compared to Tableau & Spotfire)
Difficult to understand the metadata layer because of the limited documentation available
Poor support capabilities
Requires purchasing of license every year and at the same price

4. QLIK VIEW      
Qlik View is one of the most flexible BI platform for turning raw data into knowledge. It is the market leader in data discovery. QlikView is a mature, self-contained, tightly integrated development platform used by IT or more technical users for building intuitive and interactive dashboard applications faster and easier than traditional BI platforms. More than 24,000 organizations worldwide have enabled their users to easily consolidate, search, and visually analyze all their data for unprecedented business insight using QlikView’s simplicity.

Strengths
Exceptional capabilities for data discovery
Ease of use and can easily handle complex ETL  
Fast implementation and efficient performance in crucial business intelligence projects  
Provides excellent visualization of data as a part of user interface
Product quality is great and provides strong vendor and implementation support
Weakness
Not really efficient for real-time reporting as data needs to be fetched from the underlying database periodically
It runs into a lot of scalability issues
It is comparatively very expensive. Licensing and support costs are also very high
It is not suited for non-technical users as it requires coding of scripts

5. BIRST            
Birst is the only enterprise BI platform that connects together the entire organization through a network of interwoven virtualized BI instances on-top a shared common analytical fabric. Birst delivers the speed, self-service, and agility front-line business workers demand, and the scale, security, and control to meet rigorous corporate data standards. Birst delivers all of this and much more with low TCO via public or private cloud configurations. It has defined the pioneering vision of what a set of cloud BI and analytics capabilities should look like. It has a unique two-tier data architecture coupled with a BI and analytics platform and allows customers to keep their data on-premises if they so choose.

Strengths
Data integration capabilities is excellent and is easy to use
Flexible and can be easily customized based on the users need
Provides interesting visualizations making the user experience good
Efficient with complex data management tasks such as index management
Short development time for fairly complex reports and analysis
Weakness
Lack of penetration in data discovery and mobile capabilities
Limited language support
Difficult to estimate cost as the pricing plan is non-transparent
Availability is an issue as its only available through the web  

WEIGHTED CRITERIA ANALYSIS

• Interactive Visualization: It illustrates the capability of a BI tool to depict the data models and analysis in a way that is easy to understand and visually agreeable. It also should support the ease of use such that non-technical users could also understand it easily. It should have interactive dashboards and informative visualizations. I have given this criteria a weightage of 25% because along with the reporting aspects, it is very important to analyze and understand those reports. Interactive visualization gives such capabilities and is also easier for the client to understand. Such capabilities are a liaison between the business and technical aspects     

• Modeling and Analytics: The BI tool must have the right balance between the power and ease of use. Users must be able to graphically slice and dice data from both relational and OLAP data sources and drill down to more details without any predefined limits. Users must also be able to model their required business scenarios efficiently and analyze them easily. I have given this criteria the maximum weightage (30%) as this is the basis of any BI tool. Any BI tool should incorporate strong analytic and modeling capabilities   

• Scalability and Availability: Scalability is the capability of any system to handle a growing amount of work or its potential to be enlarged to accommodate growth. In BI, it is the ability of the tool to ensure load balancing each time there is a failure. It also includes the ability of the tool to withstand load when more data and users are added into the system. It enables high availability as users can easily access data whenever they want. The reason why I chose this as one of the 5 criteria is because it’s essential for any system to withstand load and handle itself during breakdown. By not doing so, this would result in loss of information, loss of business and more delays 

• Data Integration: Data integration is a vital capability which us essential for any BI tool as it’s quite understood that there would be many disparate data sources. It’s important to integrate and unify data from various data sources. These sources might include MySQL server, applications like Oracle, Siebel and others. Generally a single environment with synchronized data makes it easier to perform operations and maintain the system. It is one of my criteria because data is being collected from variety of sources (in today’s world) and it needs to be synchronized for analysis purpose

• Cost Effectiveness: Cost is always a key factor in any technology. A BI tool should be cost effective and users should receive true value for the amount they pay. Since large organizations require a lot of analysis and reporting to be done, it may cost them huge if the tools are expensive. Various factors that influence the cost of a BI tool are server license, support costs, development cost and the fact that of its open source or not. The reason why I gave this criteria the least weightage (10%) is because if the capabilities of the tool are excellent and is even scalable, high cost of the tool won’t matter that much  

Weighted Criteria Analysis Table


Weighted Scoring

After performing the weighted analysis of the BI tools based on the core criteria, Tableau emerges as the best available BI tool. I have ranked Tableau as first and Birst as last based on my analysis. 

• Tableau is ranked first because its interactive visualizations makes it easier for non-technical users to analyze the complex data sets that are fed into the system. It also facilitates better decision-making. Data integration capabilities from disparate sources are by far one of the most efficient. It is cost effective and very scalable. It is in the leaders quadrant in the Gartner report
• Tibco Spotfire is ranked second. It has excellent data modeling capabilities. It also has excellent visualizations options. One concern with Spotfire is the costing. It is comparatively costly but the organization’s think thank are try to make strategies to address this issue. It is in the visionaries quadrant in the Gartner report
• Tibco Spotfire is followed by Qlik View with its outstanding data integration and visualization capabilities. The dashboard and reporting capabilities are one of the best. Scalability is a cause of concern for this tool. It is unable to process large set of complex data or manage large number of users within an organization. It has an above average modeling capabilities but outstanding data integration capabilities
• Pentaho is ranked fourth. Pentaho has brilliant data integration capabilities and is very cost effective (the best in the lot). The tool needs to work on its user interface, which needs to be even more user-friendly and highly interactive. It is rightly placed under Niche quadrant in the Gartner report. Although Pentaho is a new tool, it certainly challenges the leaders with its data modeling capabilities
• The lowest ranked BI tools (among these 5) based on my analysis is Birst. Although Birst ranks fifth, it is slightly (0.1) behind Pentaho. It is cost effective as it is an open source tool and easily available to the users. It also has efficient modeling capabilities. One cause of concern is the scalability.  It is rightly placed in the challenger’s quadrant in the Gartner report as it has all the features to succeed and become a leader. It might be useful for Birst to make its presence felt on a global level and address scalability issues


At last, I have few statistics for Tableau, which was ranked first based on my research and findings. Tableau is one of the fastest growing Business Intelligence tools and is also the most popular Business Intelligence/Analytics software. You can also see the Gartner’s Magic Quadrant which shows Tableau as the leader.